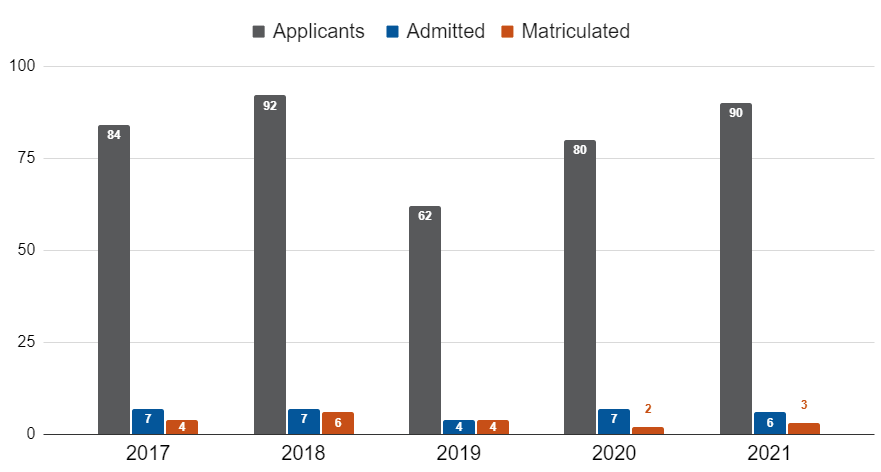
The Duke Medical Physics program provides admissions statistics for the past five application years. The statistics separate the data by MS and PhD programs. View Placement to view initial placement by graduation years.
*May include some applicants who originally applied to PhD program
Updated November 11, 2025.
Our graduates have found successful placement in a diverse variety of positions. Alumni have served as clinical medical physicists in institutions such as Duke, St…